

30 Day Map Challenge: Day 5 - Ukraine
Paying homage to Leaflet and global nonviolent protests against war


Table of contents
Day 5 Theme
For Day 5 of the 30 Day Map Challenge, the theme is "Ukraine". I immediately knew I wanted to use Leaflet for this day.
What is Leaflet?
Leaflet is the leading open-source javascript library for creating flexible and light interactive maps. It was created by Volodymyr Agafonkin, a Ukrainian citizen, who now works for Mapbox.
If you've never played around with Leaflet before, I highly recommend you give it a try. Leaflet has excellent documentation, easy-to-follow tutorials, and is managed by a great open source community who actively maintain it and its many plugins.
Folium
For today's map, I chose to use folium, a data visualization package for python that uses Leaflet to render its maps. This allows me to use Leaflet without writing in Javascript, which I'm in the process of painstakingly plodding my way through.
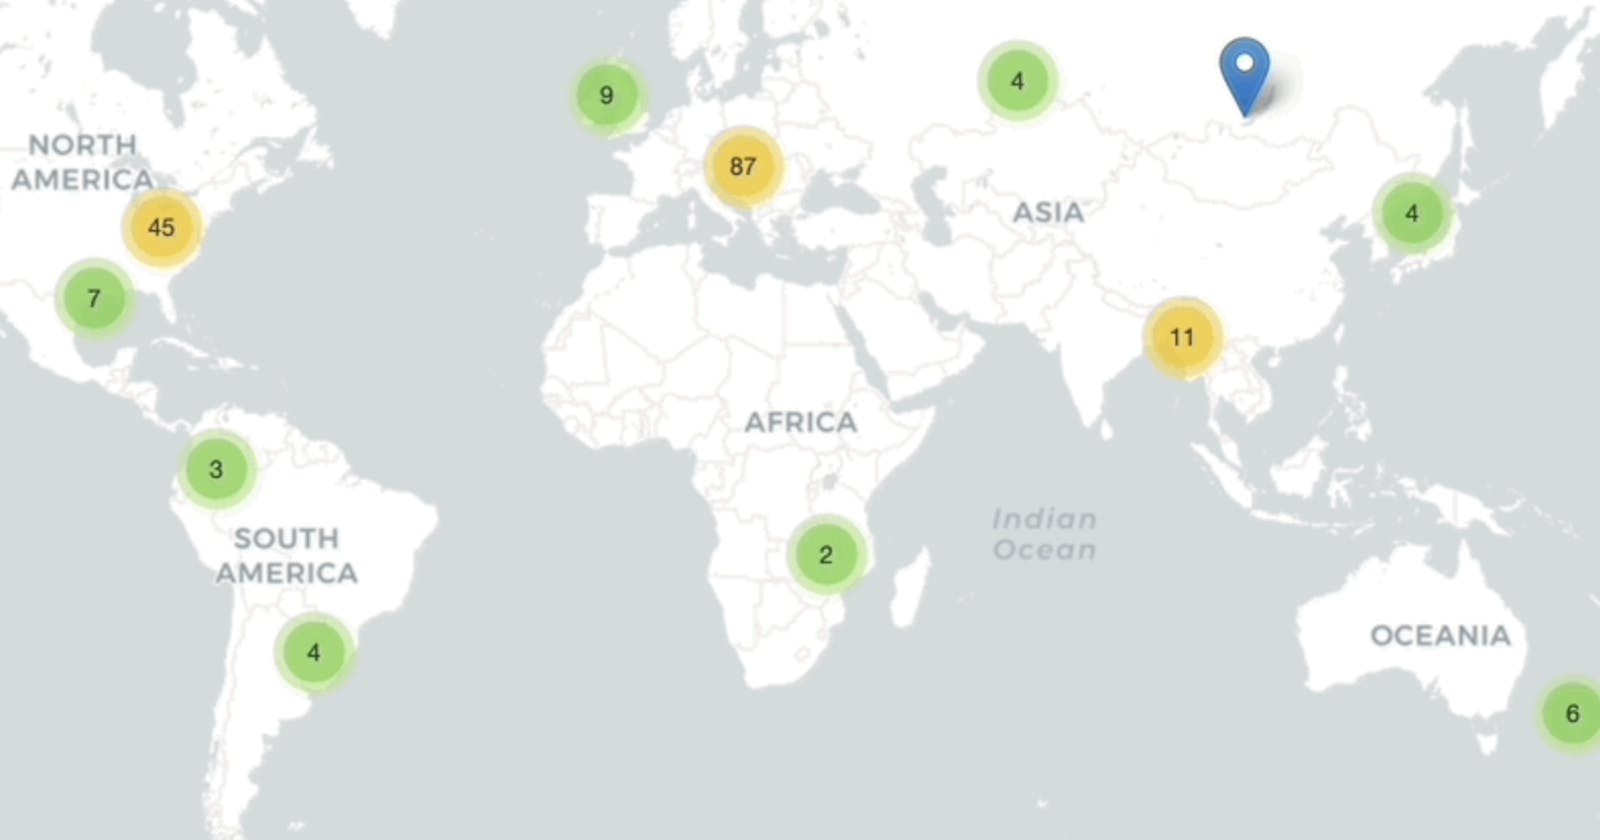
Global Protests
I wanted to create a map that shows the world's support for the people of Ukraine, and against unjust wars. So I started looking and came across this article from USA Today, which has a map and table of cities where protests were held in support of Ukraine.
I scraped the data from the table at the end of the article, which contained just the city, country, and a link to a news article for that particular protest, and saved it as a csv.
Instead of using a geocoder, I used Simple Map's World Cities database.
Using the pandas package, I joined the information from Simple Map to USA Today's protest cities data. Some manual editing needed to be done -- particularly for the US, where there are far too many cities with the same name in different states. Because the USA Today article did not include other administrative information, like State names, I clicked through to the article link to confirm which city dupes to keep and which to remove.
Once the editing was completed, I brought back a cleaned csv as a dataframe and mapped it using Folium and the Marker Cluster plugin.
The full code can be found here, as well as my datasets and a map gif of the results.
To the people of Ukraine, you are not alone.
For more information on how you can stand with Ukraine, click here.