


Days 2 - 4 (and re-doing 1 for the hell of it)
The last week was quite busy, so I found myself doing days 2 through 4 all at once. While I enjoyed playing with the What3Words API for day 1, I did feel a bit embarrassed that the actual visualization of my result was not done programmatically -- I ran out of time and wanted to get something out, so I defaulted to handy old ArcGIS Online to quickly render my map.
So I turned to leafmap, which I first came across in a YouTube video by Matt Forrest, VP of Solutions Engineering at Carto, who recommended it in his video, The Top Courses to Learn Geospatial Python.
Leafmap was created and is maintained by Professor Qiusheng Wu at the University of Tennessee, Knoxville. In Dr. Wu's own words, leafmap is:
[a] free and open-source Python package that enables users to analyze and visualize geospatial data with minimal coding in a Jupyter environment, such as Google Colab, Jupyter Notebook, and JupyterLab. Leafmap is built upon several open-source packages, such as folium and ipyleaflet (for creating interactive maps), WhiteboxTools and whiteboxgui (for analyzing geospatial data), and ipywidgets (for designing interactive graphical user interfaces [GUIs]).
Honestly, it sounded like an attempt to create an all-in-one geospatial analysis and visualization package, so I had to check it out. I decided that in my use of Leafmap, I'd stick to pulling in datasets that were already hosted somewhere -- mostly just to have an excuse to explore different data repositories and play around with their APIs.
Day 1 Revisited
I started by just making a quick point map of NYC's 2018 Central Park Squirrel Census, which can be found on NYC's Open Data Portal. Honestly, if you haven't heard of the Squirrel Census, I highly recommend you check it out for a quick giggle and cheer for Citizen Science.
I started by creating a new map:
points_map = leafmap.Map(center=[40.78124, -73.96686], zoom=13)
and then added the squirrel census data by pulling in its geojson (which you can view here) and querying columns to create a popup:
squirrels_geojson = "https://data.cityofnewyork.us/resource/vfnx-vebw.geojson"
points_map.add_point_layer(squirrels_geojson,
                           popup = ["unique_squirrel_id", "primary_fur_color", "location"],
                           layer_name="squirrels")
The resulting map can be viewed here.
Day 2 - Lines
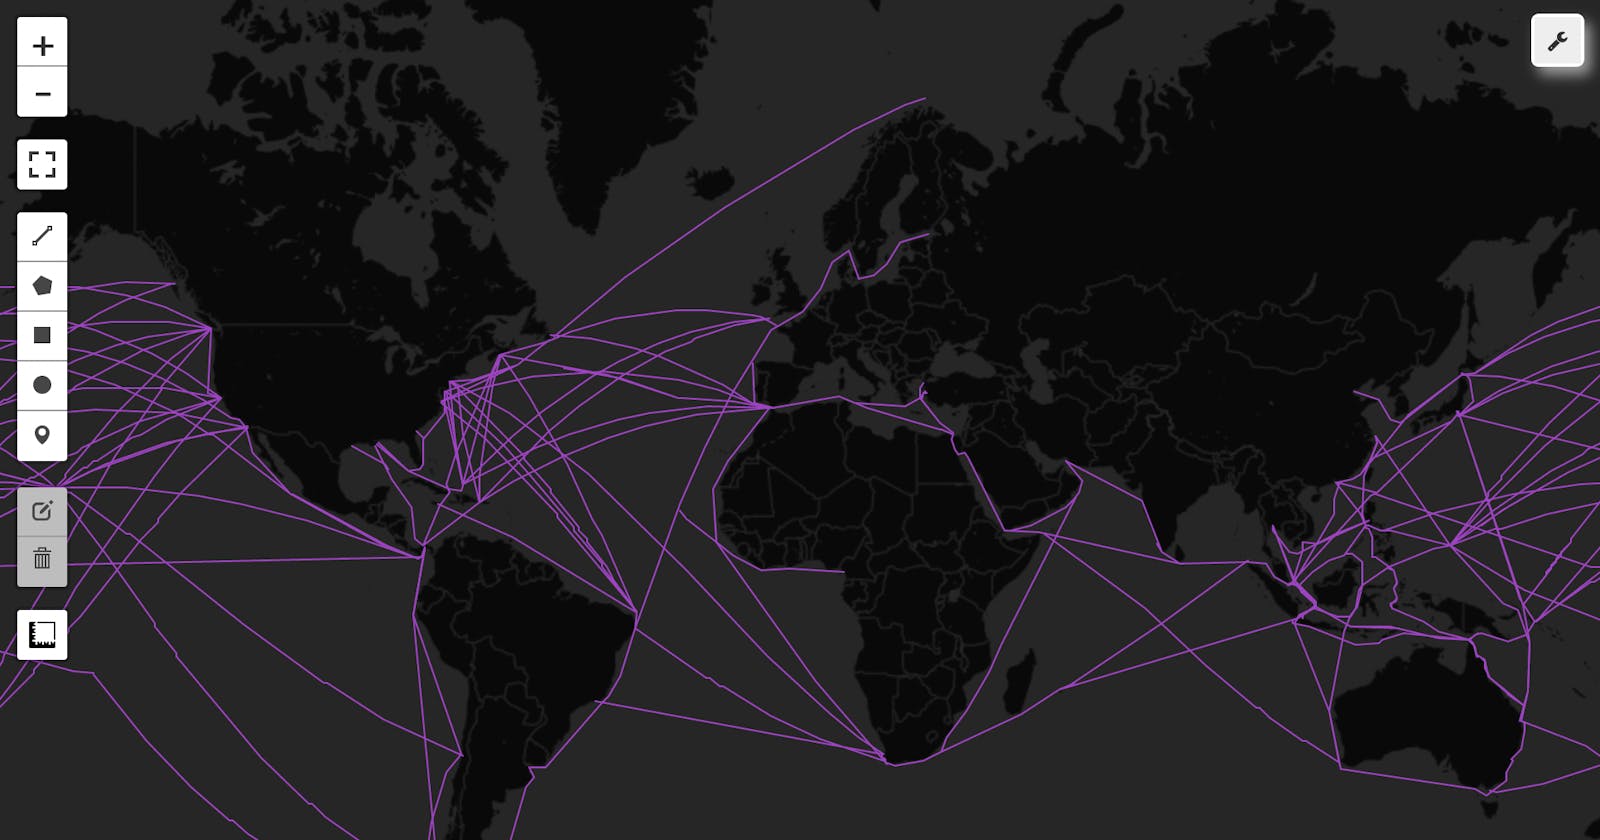
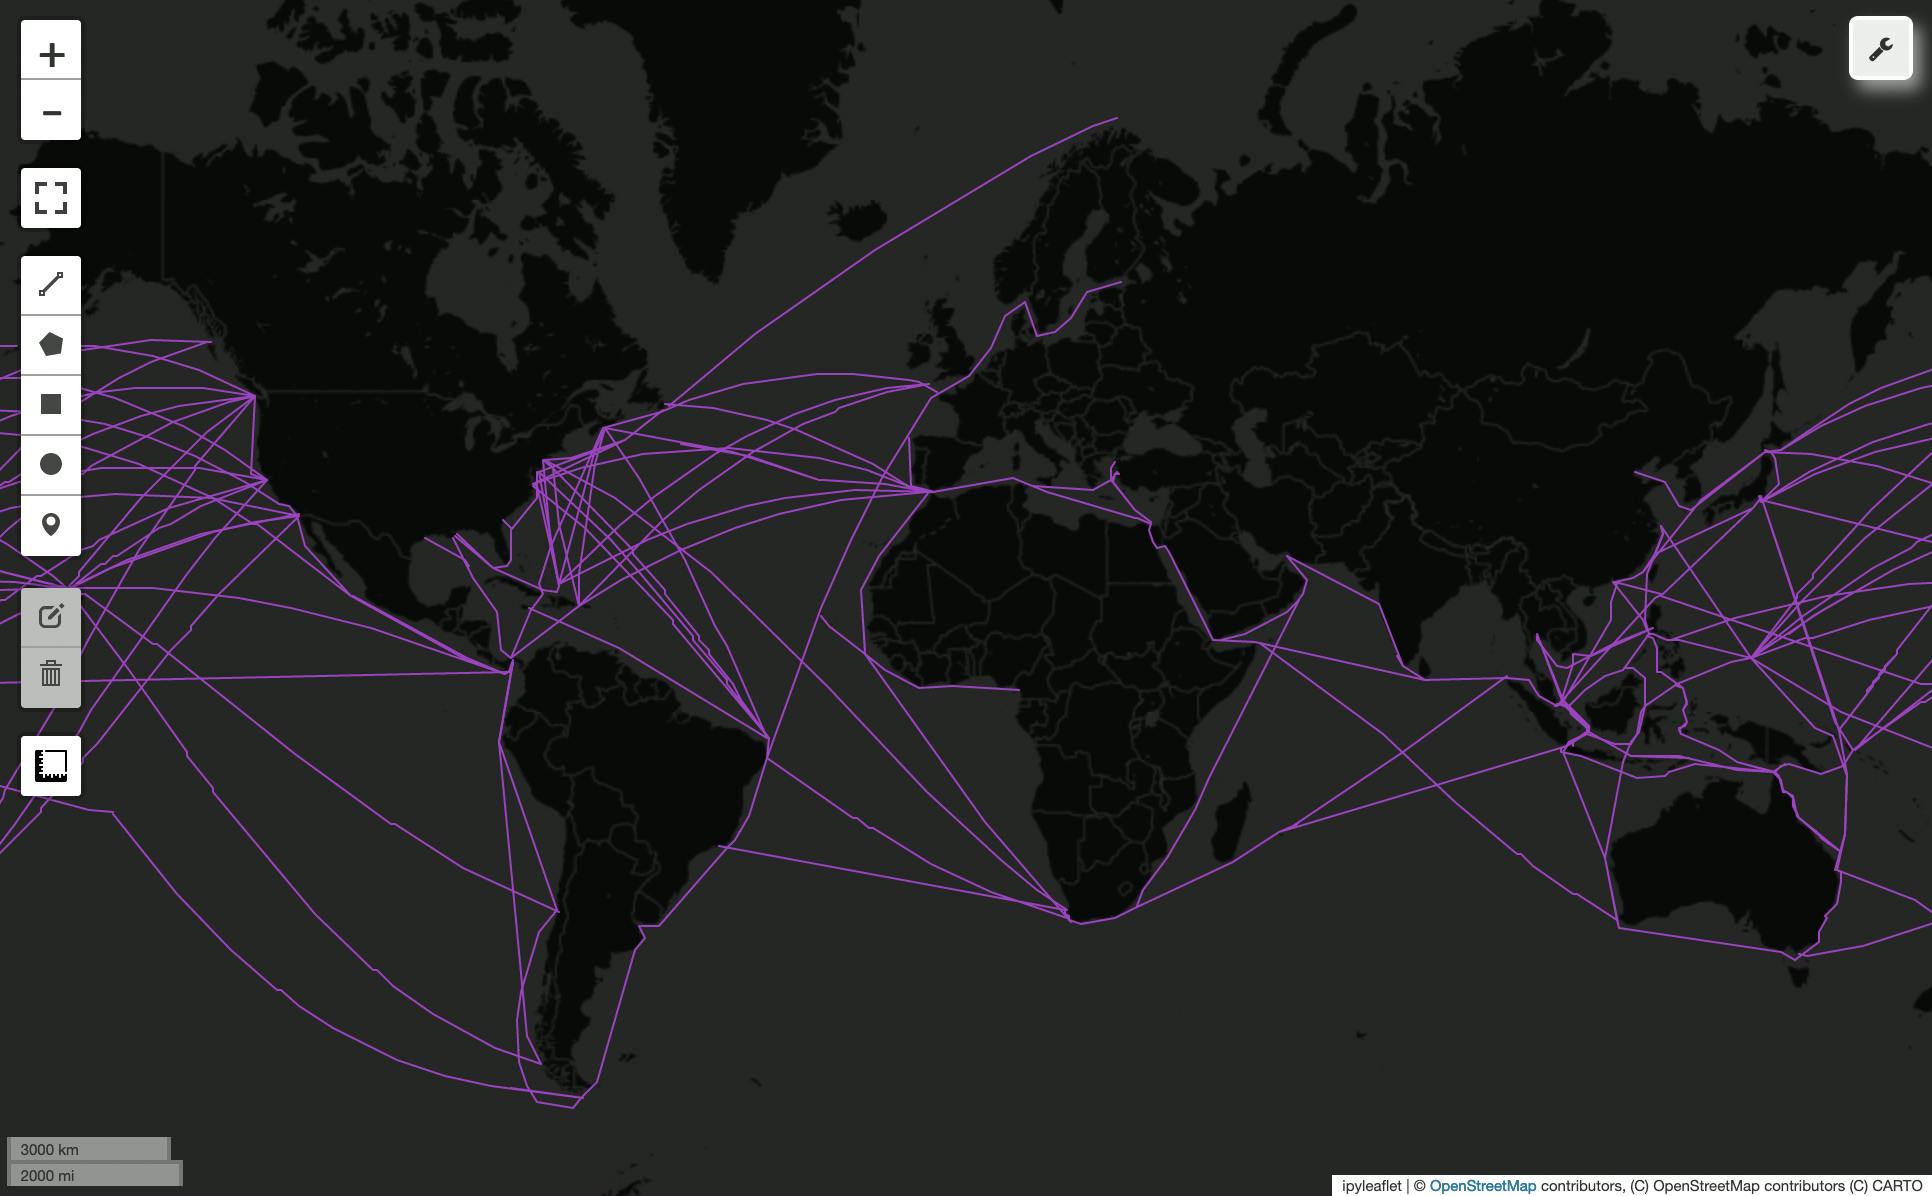
For Day 2, I grabbed this dataset of major global shipping lines.
Citation: Benden, P. (2022). Global Shipping Lanes [Data set]. Zenodo. doi.org/10.5281/zenodo.6361763
A few lines to style the polyline:
lines_map = leafmap.Map(zoom=2)
lines_map.add_basemap('CartoDB.DarkMatterNoLabels')

in_geojson = "https://github.com/newzealandpaul/Shipping-Lanes/blob/main/data/Shipping_Lanes_v1.geojson"

style = {
    "stroke": True,
    "color": "#A93CC7",
    "weight": 1,
    "opacity": 1,
}

hover_style = {"fillOpacity": 0.7}
lines_map.add_geojson(in_geojson, layer_name="Shipping Lanes", style=style)
and voila:
Day 3 - Polygons
For Day 3, I played around with Leafmap's linked maps object. Leafmap comes with a lot of data already built in as basemaps, such as layers from the Justice Map. To make a linked map, you just need to declare your array of layers and labels, and then call the linked_map object and specify the number of rows, columns, etc.
layers = ["JusticeMap.americanIndian",
          "JusticeMap.asian",
          "JusticeMap.black",
          "JusticeMap.hispanic",
          "JusticeMap.multi",
          "JusticeMap.nonWhite",
          "JusticeMap.white",
          "JusticeMap.plurality"]

labels = ["American Indian",
          "Asian",
          "Black",
          "Hispanic",
          "Multi-racial",
          "Non-white",
          "White",
          "Plurality"
         ]

polygon_map = leafmap.linked_maps(
    rows=4,
    cols=2,
    height='300px',
    layers=layers,
    labels=labels,
    center=(40, -100),
    zoom=3
)
Note -- I believe you should be able to create and store your own layers, and then add them to the map, but the documentation for this wasn't great and I was in crunch time so...here we are. Link to a gif of the maps here.
Day 4 - Green
One of my favorite geospatial data resources is the Humanitarian Data Exchange, which is a nice repository that compiles data from a variety of NGOs, NPOs, etc. To make a green-themed map, I used the World Food Programme's data on the domestic production of vegetables in Kyrgyzstan.
Instead of using add_geojson(), this time I used leafmap's add_data method to be able to create a chloropleth map of Kyrgyzstan's vegetable production by referencing one of its columns:
m = leafmap.Map()

data = 'https://geonode.wfp.org/geoserver/wfs?srsName=EPSG%3A4326&typename=geonode:average_annual_vegetable_production_4&outputFormat=json&version=1.0.0&service=WFS&request=GetFeature'

m.add_data(
    data, column = 'Vegetable', scheme = 'Quantiles', cmap = 'Greens', layer_name = 'Vegetable Production',
    legend_title = 'Veggie Production (quantiles)')
A gif of the end result can be viewed here.
My Impressions of Leafmap
For the most part, I really enjoyed playing with leafmap for days 2 - 4 (plus a redo of day 1)! It does have some weird quirks -- for example, because it's integrating multiple data visualization packages, some functions will only work if you're using a particular package, like ipyleaflet, rather than folium. You have to read through the documentation carefully, and I often did find myself wishing for more in-depth documentation, or an explanation for why certain methods had some functionality when others didn't (for example, why does add_geojson() not have the same functionality as add_data() to be able to reference a column to automatically stylize by?)
But I'm impressed with the breadth of functionality it offers. Oh, and I didn't even mention the interface it offers so that you can manually add layers, run analyses, etc ... I didn't play around with the interface when making these maps, but it was nice to know I could use it if I wanted to. Hats off to Dr. Wu!